Lesson Overview
To develop knowledge of the elements related to weather information by analyzing weather reports, charts, and forecasts from various sources.
References : Pilot’s Handbook of Aeronautical Knowledge (Chapter(s) : 12;13), Aviation Weather (AC 00-6B), ** INVALID TAG :: ac-00-45 **, 14 CFR Part 91, Airmans Information Manual
| Elements |
|
| Schedule |
|
| Equipment |
|
| IP Actions |
|
| SP Actions |
|
| Completion Standards |
The lesson is complete when the student can decipher and use the weather reports, charts, and sources to make a competent “go/no-go” decision. |
Instructor Notes
| Attention |
Instead of getting ourselves stuck, in the air, in a thunderstorm or some sort of extreme weather we should have a good understanding of weather information in order to know when to and not to fly. |
| Overview |
Review Objectives and Elements/Key ideas |
| What |
Through a complex system of weather services, government agencies, and independent weather observers, pilots are given vast information regarding weather patterns, trends, and characteristics in the form of up-to-date weather reports and forecasts. |
| Why |
These reports and forecasts enable pilots to make informed decisions regarding weather and flight safety. |
Lesson Details
This is a continuation of the first lesson "3-B: Weather Information", and dives into the details of various weather report and chart products, whereas the previous portion of 3-B was more focused on weather theory.
METAR, TAF, and FA
The METAR, TAF, and FA reports are textual weather products which provide current observations, terminal forecasts, and area forecasts respectively.
This is an observation of current surface weather reported in a standard international format. It contains the following information in sequential order.
- Type of Report
-
There are two types, with the first being a routine METAR report and the second being a special weather report (SPECI). The special is issued whenever there is rapidly changing weather, aircraft mishaps, etc.
- Station Identifier
-
This is a four-letter identifier (i.e. KTTA) for the reporting station. The first letter is the country identifier (K for continental US, PA for Alaska, and PH for Hawaii), and the other three letters are the specific airport.
- Date/Time
-
Reported as a six-digit group where the first 2 digits are the date, and the last 4 are the time in UTC.
- Modifier
-
Denotes that the METAR came form an automated source or was corrected. AUTO indicates an automated source, A01 and A02 indicate the type of precipitation sensors at the station, and COR indicates a corrected report.
- Wind
-
This is reported with 5 digits unless the speed is greater than 99 knots, at which point it becomes a 6 digit group. The first 3 digits indicate wind direction in tens of degrees. The last 2 digits indicate the speed of wind in knots. Gusting winds (G) show with the peak gust after the "G". If the wind varies more than 60° and the speed is greater than 6 knots a separate group of numbers separated by a "V" will indicate the extremes of the directions.
- Visibility
-
This is generally reported in statute miles. A runway visual range (RVR) is sometimes reported after the visibility. It is shown with an "R", then the runway number, a slant/slash, and the visual range in feet.
- Weather
-
This is reported in two different categories: Qualifiers and Weather Phenomenon. Qualifiers show intensity or proximity as well as descriptor codes (e.g. -, +, VC, SH, TS, FZ, etc.) and phenomena describe the different precipitation, obscuration, and other phenomena (e.g. DZ, RA, HZ, SS, DS, SN, etc.).
- Sky Condition
-
This is always reported in the sequence of amount, height, and then type. heights are depicted with three digits in hundreds of feet above ground (though clouds above 12,000 feet are not reported). TCU and CB clouds are reported with their height. The amount of sky coverage is reported in eighths of the sky from horizon to horizon. They are denoted (in increasing coverage order) by SKC/CLR (clear), FEW (clear to few), SCT (scattered), BKN (broken), and OVC (overcast).
- Temp/Dewpoint
-
This is reported in degrees Celsius, and temperatures below 0 are preceded by the letter "M".
- Altimeter
-
This is the barometric pressure in inches of mercury presented as a four-digit value. "PRESRR" or "PRESFR" represent rising or falling pressure.
- Remarks
-
This may include wind data, variable visibility, begin/end times of the phenomenon, pressure info, and various other necessary information.
Type of Report: Routine METAR
Location: Baton Rouge, Louisiana
Date: 16th day of the month
Time: 1753 Zulu
Modifier: None shown
Wind Information: Winds 140 at 21 knots gusting to 26 knots
Visibility: ¾ SM
Weather: Light rain and mist
Sky Conditions: Skies broken 800 ft., Overcast 1,200 ft.
Temperature: Temp 18 degrees C, Dewpoint 17 degrees C
Altimeter: 29.70 in. Hg.
Remarks: Barometric pressure is falling
The terminal aerodrome forecast is a report established for the 5sm radius around an airport. It is valid for a 24-hour period, and is updated four times a day at 0000Z, 0600Z, 1200Z, and 1800Z. The TAF utilizes the same descriptors and abbreviations as the METAR. It contains the following information in sequential order.
- Type of Report
-
This can either be a routine forecast (TAF) or an amended forecast (TAF AMD).
- Station Identifier
-
Same as METAR.
- Date/Time
-
Reported as a six-digit group where the first 2 digits are the date, and the last 4 are the time in UTC.
- Valid Period
-
This is given as a 6-digit number group. The first 2 digits are the date, the next 2 are the begining time for the valid period, and the last 2 are the end time.
- Fcst Wind
-
The wind direction and speed forecasts are given in a five-digit number group.
- Fcst Visibility
-
Given in statute miles, where greater than 6sm is shown as P6SM.
- Fcst Significant Weather
-
Coded the same as a METAR with no significant weather being coded as NSW.
- Fcst Sky Condition
-
Same as the METAR, though only "CB" clouds are forecast.
- Fcst Change Group
-
For any significant weather change forecast to occur, the expected conditions and time period are included, This information can be shown as:
-
FM - From is used when a rapid and significant change, usually within an hour, is expected
-
BECMG - Becoming is used when a gradual change is expected over no more than 2 hours
-
TEMPO - Temporary is used for temporary fluctuations, expected to last for less than an hour
-
- Probability Fcst
-
The given percentage that describes the probability of thunderstorms and precipitation occurring in the coming hours.
Routine TAF for Pierre, South Dakota. On the 11th day of the month, at 11:30Z. Valid for 24 hours from 1200Z on the 11th to 1200Z on the 12th. Wind from 150 at 12 knots. Greater than 6 SM visibility. Broken clouds at 9,000 ft.
Temporarily, between 1200Z and 1400Z, visibility 5 SM in mist.
From 1500Z winds from 160 at 15 knots, gusting to 25 knots. Visibility greater than 6SM, and clouds broken at 8,000 ft., overcast at 15,000 ft.  Between 0000Z and 0400Z, there is a 40 percent probability of visibility 3 statute miles, thunderstorms with moderate rain showers, clouds broken at 3,000 feet with cumulonimbus clouds.
From 0400Z winds are from 140 at 18 knots, visibility greater than 6 SM. Clouds at 4,000 ft. scattered and overcast at 8,000’. Temporarily between 0400Z and 0800Z, visibility 3 SM, thunderstorms with moderate rain. Clouds overcast at 3,000 ft. with cumulonimbus clouds.
Becoming between 0800Z and 1000Z, wind from 320 at 7 knots. End of report =
The FA gives a picture of clouds, general weather conditions, and VMC expected over a large area encompassing several states. This forecast gives information vital to enroute operations as well as forecast information for smaller airports that do not have terminal forecasts. There are six areas for which area forecasts are published in the contiguous 48 states. Area forecasts are issued 3 times a day and are valid for 18 hours.
The area forecast HEADER is comprised of four sections. They give the location identifier of the source of the FA, the data and time of issuance, the valid forecast time, and the area of coverage.
The area forecast shows information given by Dallas Fort Worth, for the region of Oklahoma, Texas, Arkansas, Louisiana, Mississippi, and Alabama, as well as a portion of the gulf coast waters. It was issued on the 12th day of the month at 0945. The synopsis is valid from the time of issuance until 0400 hours on the 13th. VFR clouds and weather information on this area forecast is valid until 2200 hours on the 12th and the outlook is valid until 0400 hours on the 13th.
The area forecast also includes precautionary statements. This will include IFR conditions, mountain obscuration, and thunderstorm hazards are described. Statement of height are in MSL, and if given otherwise AGL or CIG will be noted.
The FA covers VFR clouds and weather, so the precautionary statement warns that AIRMET Sierra should be referenced for IFR conditions and mountain obscuration. The code TS indicates the possibility of thunderstorms and implies there may be occurrences of severe or greater turbulence, severe icing, low-level wind shear, and IFR conditions. The final line of precautionary statement alerts the user that heights for the most part are mean sea level (MSL). Those that are not MSL will be above ground level (AGL) or ceiling (CIG).
Next the area forecast can include a Synopsis which is a brief summary identifying the location/movement of pressure systems, fronts, and circulation patterns.
As of 1000Z, there is a low-pressure trough over the Oklahoma and Texas panhandle area, which is forecast to move eastward into central southwestern Oklahoma by 0400Z. A warm front is located over Central Oklahoma, southern Arkansas, and northern Mississippi at 1000Z is forecast to lift northwestward into northeastern Oklahoma, northern Arkansas, and extreme northern Mississippi by 0400Z
Then finally the area forecast can include VFR clouds and weather which lists the expected sky conditions, visibility, and weather for the next 12 hours as well as an outlook for the following six hours.
In south central and southeastern Texas, there is a scattered to broken layer of clouds from 1000ft AGL with tops at 3,000 ft., visibility is 3 to 5 statute miles in mist. Between 1400 Zulu and 1600 Zulu, the cloud bases are expected to increase to 3,000 ft. AGL. After 1900Z, the cloud bases are expected to continue to increase to 5,000 ft. AGL and the outlook is VFR.
In northwestern Oklahoma and panhandle, the clouds are scattered at 3,000 ft. with another scattered to broken layer at 10,000 ft. AGL, with tops at 20,000 ft. At 1500Z, the lowest cloud base is expected to increase to 4,000 ft. AGL with a scattered layer at 10,000 ft. AGL. After 2000Z, the forecast calls for scattered thunderstorms with rain developing and a few becoming severe; the cumulonimbus clouds will have tops at flight level 450 or 45,000 ft. MSL.
Surface Analysis Chart
The surface analysis chart depicts an analysis of the current surface weather. It is a computer prepared report transmitted every 3 hours covering the contiguous 48 states, and adjacent areas. It shows areas of high/low pressure, fronts, temps, dewpoints, wind direction/speed, local weather, and visual obscurations.
Surface weather observations for reporting points across the US are also depicted on this chart. Each of these reporting points is illustrated by a station model, and each model will include the following items.
- Type of Observation
-
A round icon indicates an official weather observer, and a square icon indicates an automated station.
- Sky Cover
-
Shown as clear, scattered, broken, overcast, or obscured/partially obscured.
- Clouds
-
Cloud types are represented by specific symbols. Low cloud symbols are placed beneath the station model, while middle and high cloud symbols are placed directly above the station model. Typically, only one type of cloud will be depicted with the station model.
- Sea Level Pressure
-
This value is given as a 3-digit number representing the pressure to the nearest tenths of a millibar. For 1000 millibars or greater prefix a 10 to the 3 digits and for less than 1000 millibars prefix a 9 to the 3 digits.
- Pressure Change/Tendency
-
This is a value that represents the change in tenths of a millibar over the past 3 hours, shown directly below the sea level pressure.
- Precipitation
-
This reports the precipitation that has fallen over the last 6 hours to the nearest hundredth of an inch.
- Dewpoint
-
This the the dewpoint value in Fahrenheit.
- Temperature
-
This is the temperature value in Fahrenheit.
- Wind
-
This is the true direction of the wind given by the wind pointer line which indicates the direction from which the wind is coming. It includes "barbs" that show wind velocity, with a short barb indicating 5 knots, a long barb indicating 10 knots, and a pendant indicating 50 knots.
Radar Summary Chart
This is a graphical depicted collection of radar weather reports (SDs) displaying areas of precipitation as well as information regarding the characteristics of the precipitation. The chart is published hourly at 35 minutes past the our. A radar summary chart includes the following information.
- No Information
-
If information isn’t reported it will say "NA" and if no echoes are detected it will report "NE".
- Precipitation Intensity Contrours
-
These are described as one of 6 levels and are shown by 3 contour intervals.
- Height of Tops
-
The heights of the echo tops are given in hundreds of feet MSL.
- Movement of Cells
-
This is indicated by an arrow pointing in the direction of movement with speed in knots at the top of the arrow head (and "LM" indicates "little movement").
- Type of Precipitation
-
This is marked using specific symbols (not those used in the METAR).
- Echo Configuration
-
Echoes are shown as being areas, cells, or lines.
- Weather Watches
-
These are depicted by boxes outlined with heavy dashed lines.
The radar summary chart has some limitations. They depict only areas of precipitation, will not show areas of clouds and fog with no appreciable precipitation, and will not show the heights of the tops and bases of the clouds.
Winds and Temperature Aloft Chart
These charts provide winds and temperatures aloft, and are made twice a day at 0000Z and 1200Z. The forecasts through 12,000 feet are true altitudes, and above 18,000 feet are pressure altitudes.
The wind is always referenced to true north, adn the wind speed is always given in knots. No winds are forecast when a given level is within 1,500 feet of station elevation.
The winds direction and speed are listed together in a 4-digit code where the first two digits indicate the direction the wind is blowing from in tens of degrees and the second two numbers indicate the speed of the wind.
If the wind speed is greater than 100 knots but less than 199 knots, 50 is added to the direction and 100 is subtracted from the speed. Therefore, to decode 7319 subtract 50 from the direction and add 100 to the speed. This would result in wind that was 230° at 119 knots.
If the wind speed is greater than 200 knots the wind group is coded as 99 knots. Therefore, to decode 7799 subtract 50 from the direction, and add 100 to 99. This would result in wind that was 270° at 199 knots or greater.
Light and variable winds are coded as 9900.
The temperature is always given in Celsius, and no temperatures are forecast for any station with 2,500 feet of station elevation. Temperatures above 24,000 feet are negative.
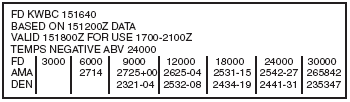
The heading indicates that this FD was transmitted on the 15th of the month at 1640Z and is based on the 1200 Zulu radiosonde. The valid time is 1800 Zulu on the same day and should be used for the period between 1700Z and 2100Z. The heading also indicates that the temperatures above 24,000 feet MSL are negative. Since the temperatures above 24,000 feet are negative, the minus sign is omitted. A 4-digit data group shows the wind direction in reference to true north, and the wind speed in knots. The elevation at Amarillo, TX (AMA) is 3,605 feet, so the lowest reportable altitude is 6,000 feet for the forecast winds. In this case, “2714” means the wind is forecast to be from 270° at a speed of 14 knots. A 6-digit group includes the forecast temperature aloft. The elevation at Denver (DEN) is 5,431 feet, so the lowest reportable altitude is 9,000 feet for the winds and temperature forecast. In this case, “2321-04” indicates the wind is forecast to be from 230° at a speed of 21 knots with a temperature of -4°C.
Significant Weather Prognostic Charts
These charts portray forecasts of selected weather conditions at specified valid times. These forecasts are made from a comprehensive set of observed weather conditions. Those observed conditions are extended forward in time and become forecasts by considering atmospheric and environmental processes. Each valid time is the time at which the forecasts conditions are expected to occur, and are printed on the lower left-hand corner of each panel.
On these charts the altitude information is referenced to MSL, and below 18.000 feet are true altitudes and above 18.000 feet are pressure altitudes. These charts are generated for two general time periods. Day 1 prog charts are forecast for the first 24 hour period and prepared for two altitude references. Day 2 prog charts are forecast for the second 24 hour period. These charts are available for both low-level significant weather and high-level significant weather.

The weather information in the low level chart contains information from the surface to FL240 (400 millibars), and for two forecast periods: 12 hours and 24 hours.
The chart is divided into four panels. The upper two panels depict the 12 and 24 hour significant weather progs. The significant weather panels display forecast weather flying categories (VFR/IFR/MVFR), freezing levels, and turbulence. A legend on the chart illustrates symbols and criteria used for these conditions.
The lower two panels depict the 12 and 24 hour surface progs. These display forecast positions and characteristics of pressure systems, fronts, and precipitation. Standard symbols are used to show fronts and pressure centers. Direction of movement of the pressure center is depicted by an arrow, and the speed in knows is shown next to the arrow. Areas of forecast precipitation and thunderstorms are outlined on the chart. Shaded areas of precipitation indicate at least 1/2 the area is affected by the precipitation. Unique symbols indicate the type of precipitation and the manner in which it occurs.
This chart is used to provide an overview of selected flying weather conditions up to 24,000 feet for day 1. Surface winds can be inferred from surface pressure patterns. Structural icing can be inferred in areas with clouds and precipitation, above freezing levels, and in areas of freezing precipitation. These charts are used to obtain an overview of the progression of weather during day1.
These charts are a Day 2 forecast of general weather for the conterminous US. They are an extension of the Day 1 low-level prog chart issued from the same observed data base. This chart is issued two times daily at 0000Z and 1200Z, and are valid for 36/48 hours after observed.
The chart is composed of two panels and a forecast discussion, with the panels containing the 36 and 48 hour surface progs. The panels display forecast positions and characteristics of pressure patterns, fronts, and precipitation. They provide information regarding only surface weather forecasts, including a discussion of the forecast. Standard symbols are used to show fronts and pressure centers. Precipitation areas are outlined in every panel. The forecast discussion is a discussion of the Day 1 and Day 2 forecast package, including identification and characterization of weather systems and associated weather conditions portrayed on the prog charts.
These charts are used to provide an overview of the forecast general weather conditions outlook for Day 2, and can be used to assess the progression of weather through Day 2.

The high level significant weather prog chart is a Day 1 forecast of significant weather covering a large portion of the Northern hemisphere, and a limited portion of the Southern hemisphere. Weather information pertains to the layer from 24,000 feet to 60,000 feet. Conditions routinely appearing are jet streams, CB clouds, turbulence, and tropopause heights. Surface fronts are also included to add perspective. Tropical cyclones, squall lines, eruptions, sandstorms, and dust storms will also appear. Each prog chart is issued 4 times a day at 00Z, 06Z, 12Z, and 18Z.
These charts are to be used for preflight planning. However, this chart should always be viewed in light of current conditions and specific local area forecasts.
Convective Outlook Chart
This chart is designed specifically to forecast areas expected to have thunderstorms. It is presented in two panels. The left-hand panel is the Day 1 convective outlook. This outlines areas where thunderstorms are forecast for the Day 1 period. This outlook qualifies the risk (SLGHT, MDT, HIGH) and areas of general thunderstorms. This chart is issued 5 times daily. The first issuance is at 06Z and is the initial Day 1 outlook, valid 12Z until 12Z the following day. Other issuances are at 1300Z, 1630Z, 2000Z, and 0100Z. All issuances are valid until 12Z the next day.
The right-hand panel is the Day 2 convective outlook. It contains the same information as the Day 1 outlook, and is issued 2 times a day. The first issuance is at 0830Z during standard time and 0730Z during daylight time. It is updated at 1730Z.
The levels of risk come in 3 varieties, based on the number of severe thunderstorm reports per geographical unit and forecaster confidence. The phrase "SEE TEXT" is used for situations where slight risk was considered, but at the time of the forecast was not warranted. The severity levels are described below.
| SLGT |
Well-organized severe Thunderstorms expected but in small numbers/low coverage. A high probability of 5-29 reports of 1 inch or larger hail, and/or 3-5 tornadoes, and/or 5-29 wind events, or a low/moderate probability of moderate to high risk being issued later if some conditions come together. |
| MDT |
This designation denotes a greater concentration of severe thunderstorms, and greater magnitude of severe weather. A high probability of at least 30 reports of hail 1 inch or larger; 6-19 tornadoes; or numerous wind events (30). |
| HIGH |
This almost always means a major weather outbreak is expected, with great coverage. A high probability of at least 20 tornadoes with at least two of them rated F3 (or higher), or an extreme derecho causing widespread (50 or more) wind events with numerous higher-end wind (80 mph or higher) and structure damage reports. |
| See Text |
Used for those situations where a slight risk was considered but at the time of the forecast the designation SLGT was not warranted. |
This chart should be used as a flight planning tool to determine forecast areas of thunderstorms.
AWOS, ASOS, and ATIS reports
These are systems designed to inform the pilot of immediate current weather conditions (and other information). They are similar in nature, but vary in their specific details.
This system is designed to provide a continuous minute-by-minute set of observations. ASOS software transmits a SPECI report whenever it determines a significant change in conditions has occurred. ASOS observation contain the following information.
-
Cloud Height Indicator
-
Visibility Sensor
-
Precipitation Identification Sensor
-
Freezing Rain Sensor (at select sites)
-
Pressure Sensors
-
Ambient Temperature and Dew Point Temperature Sensors
-
Anemometer (wind direction and speed)
-
Rainfall Accumulation Sensor
Some ASOS installations also include a precipitation discriminator which differentiates liquid/frozen precipitation. If it has this capability it is designated as A02 in the "remarks" section, otherwise it is designated A01. Also, at selected ASOS installations lightning detection equipment is installed.
ASOS can not distinguish between stratus and cumulonimbus clouds, and it is also limited in its ability to identify restrictions to visibility. There are five levels of ASOS service available.
- Level A
-
This is the highest level which is typically available at major airports like those in or near Class B airports. Other levels offer less human augmentation, with fewer types of weather reported.
- Level B
-
This level has human observers available 24 hours a day.
- Level C
-
This level is generally at airports with part-time towers (and human augmentation ends when tower closes).
- Level D
-
These are found at smaller, nontowered airports meeting the FAA or NWS criteria for the ASOS. They are unattended, and always contain the AUTO designation when in a METAR.
This was the first widely installed automated weather data gathering system at US airports. AWOS is available in lesser configurations without all the types of observations listed above. Like ASOS, there are various levels of service available from AWOS installations.
- AWOS-A
-
Only reports the altimeter setting.
- AWOS-1
-
Also measures and reports wind speed, direction, gusts, temperature, and dew point.
- AWOS-2
-
Adds visibility information.
- AWOS-3
-
This is the most capable system. It also includes cloud/ceiling data (and is essentially equivalent to ASOS). Like ASOS, AWOS-3 can include precipitation discrimination sensors indicated by A02. Lightning detection is also a possible enhancement for selected AWOS-3 sites.
The difference between ASOS/AWOS is the ability to identify and report significant changes in surface weather. AWOS transmits 3 reports per hour at fixed intervals and cannot issue a special report as needed.
This is a continuous broadcast of recorded non-control information in busier terminal environments. It generally contains essential information such as weather, active runways, approaches, and other required information (NOTAMs).
These broadcasts are updated when there is a significant change in the information. Each broadcast is given a letter identification. In its simplest form the ATIS is a continually playing recording of a person reading the message. This message is re-recorded at every update (which is several times per hour at least), and can get quite cumbersome.
Data may be entered by hand, coming from a METAR, or be taken directly from sensors. More modern ATIS systems are fully automated and do not require a controller except in the case of sensor failure or unusual activities.
Some airports separate ATISs for arriving and departing aircraft, each on its own frequency.
Conclusion
It is very important to be able to interpret and make a Go/No Go decision based on the information attained. A safe flight begins with a thorough weather briefing to ensure the pilot understands the meteorological factors that may affect the flight.
ACS Requirements
To determine that the applicant exhibits instructional knowledge of the elements related to weather information by describing:
-
Importance of a thorough preflight weather briefing.
-
Various means and sources of obtaining weather information.
-
Use of real-time weather reports, forecasts, and charts for developing scenario-based training.
-
In-flight weather advisories.
-
Recognition of aviation weather hazards to include wind shear.
-
Factors to be considered in making a “go/no-go” decision.